We loved our old website. It reflected the mission of our studio well but we must admit it had one major flaw. We received a lot of feedback that our homepage animation lacked accessibility and was using quite a bit of computational power to run. We had to do something about it at some point. That time came once we evolved our branding, adding some elements here and there – a new step for us. Having been building low-carbon websites for a few years, we are constantly questioning our approach and trying to find better ways to get results, communicate them and find room for improvement. And at this point in time, the deeper you dive into the low-carbon impact measurement, the more questions, rather than answers, can come up.
The challenge of measuring carbon emissions of digital products
Accurately assessing their carbon emissions is a puzzle we're still solving, mainly because there's no one-size-fits-all method for measuring their energy use. Here are some of the challenges faced today:
- Lack of Data: Gathering precise information on energy use is difficult due to limited access to data from hosting providers, data centers, and device manufacturers.
- No Standardization: There is no universally accepted method for measuring the energy consumption of digital products, leading to varying results from different tools and approaches.
- Multiple Variables: Digital products are influenced by countless factors, including user behavior, hardware, software, and network configurations, making it difficult to pinpoint their energy consumption accurately.
- Geographic Variations: With users accessing digital products globally, the energy sources used vary by region, making environmental impact calculations more complex.
- Lack of Back-End Measurement Tools: The back-end infrastructure, often overlooked, significantly contributes to energy use, but quantifying it is challenging.
- Unpredictable User Behavior: User actions, such as streaming video versus reading text, affect energy consumption differently, making predictions challenging.
- Ignoring Production Phase: Designing and developing digital products require energy consumption, which is often overlooked in assessments.
- Difficulty Measuring Other Environmental Impacts: Measuring factors like water consumption is also a challenge.
Data transfer is the best proxy
for now.
In his article "Is Data the best proxy for measuring carbon emissions?", Fershad Irani, a web sustainability consultant working with the Green Web Foundation, suggests that although data transfer is currently the best proxy for measuring website carbon emissions, it is not the most accurate measure. Ideally, we would be able to use actual energy consumption figures from both the server and device level to calculate the carbon intensity of a webpage, but such tools are not yet available.
As a company dedicated to building low-carbon websites, what should we do now? We need effective measures.
Our first step is to always stay updated with new tools. However, in the meantime, we've been using imperfect tools and metrics to build, improve, and communicate about our products. These metrics are not entirely accurate, but they offer some insights. The limitations of these tools, and the data transfer metric, became apparent as we designed our new website.
With the same amount of data transferred, two websites can have a significantly different impact.
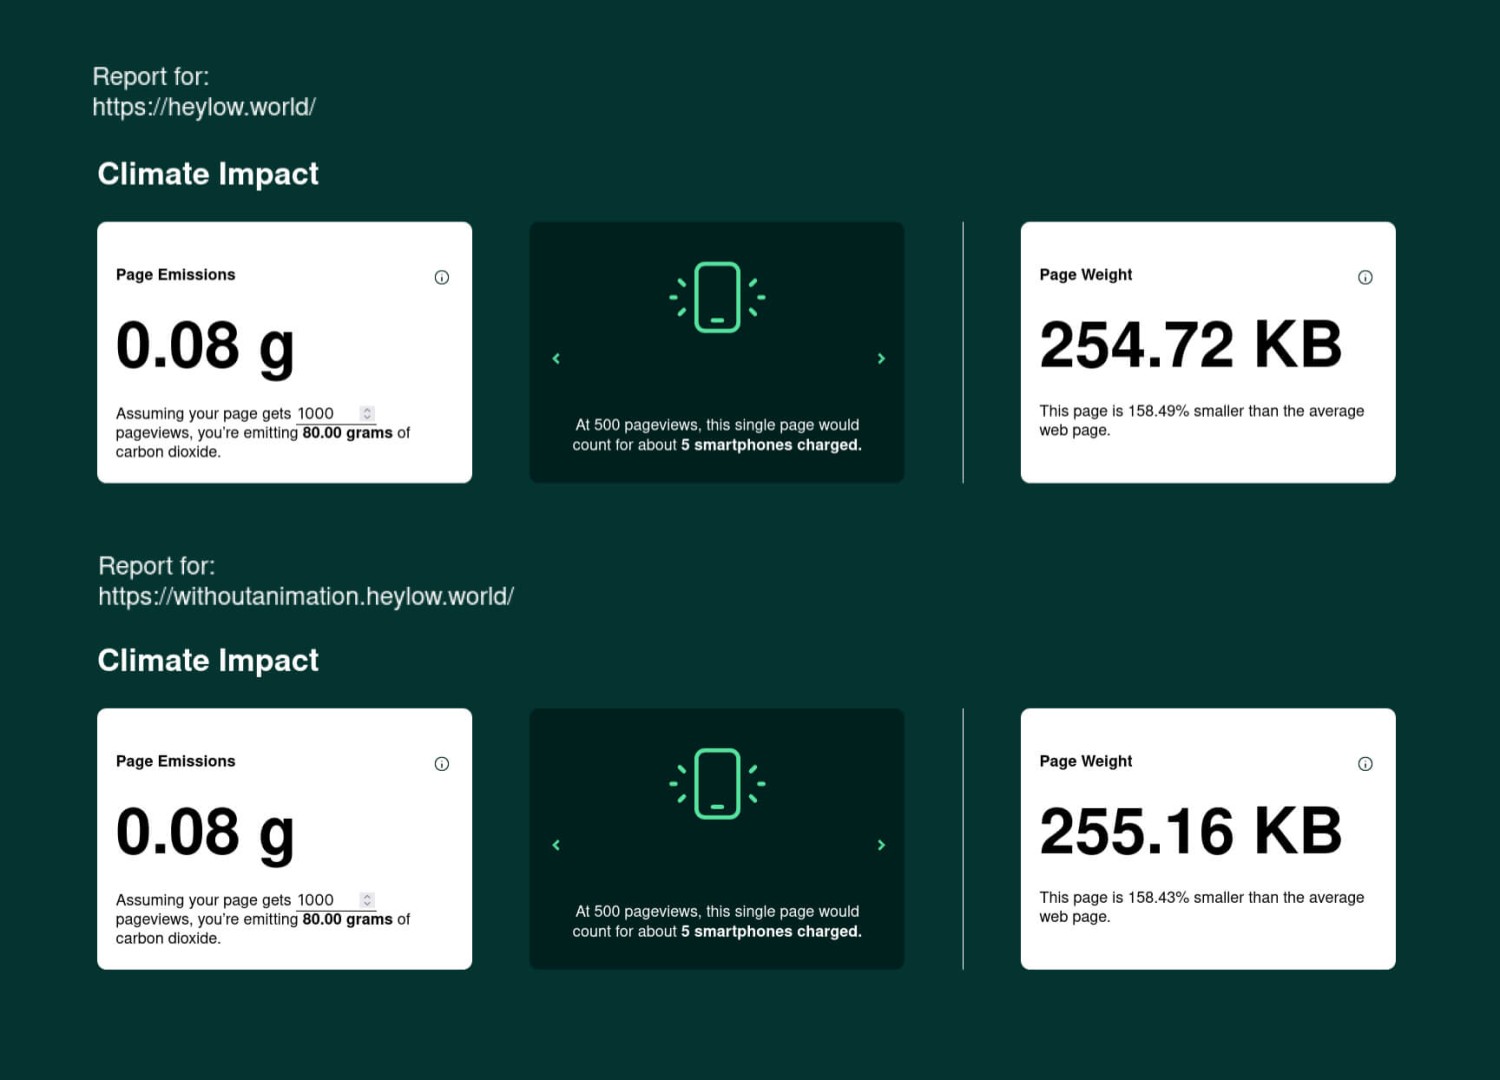
We always suspected that animations could have a significant impact on the environmental footprint of a website, but measuring this impact was challenging. To illustrate this, we ran a test with our previous website, comparing the default version to one without the main animation. Using EcoGrader, a tool primarily based on data transfer (augmented by Google Lighthouse results), both sites showed similar results.

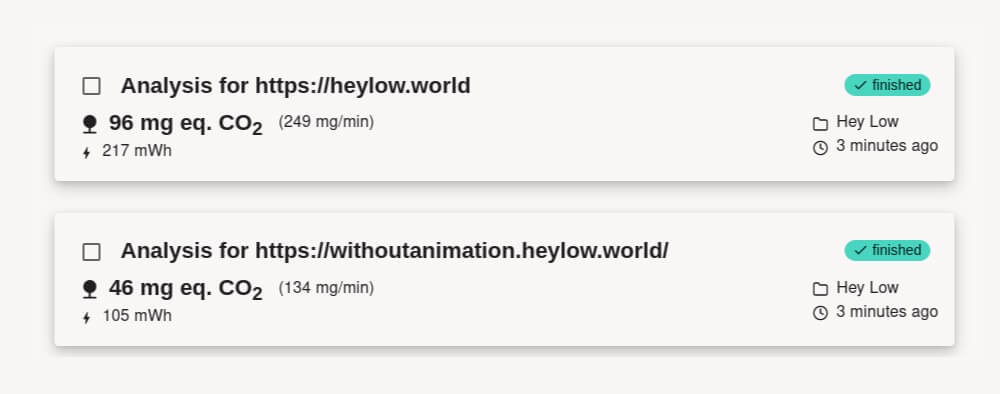
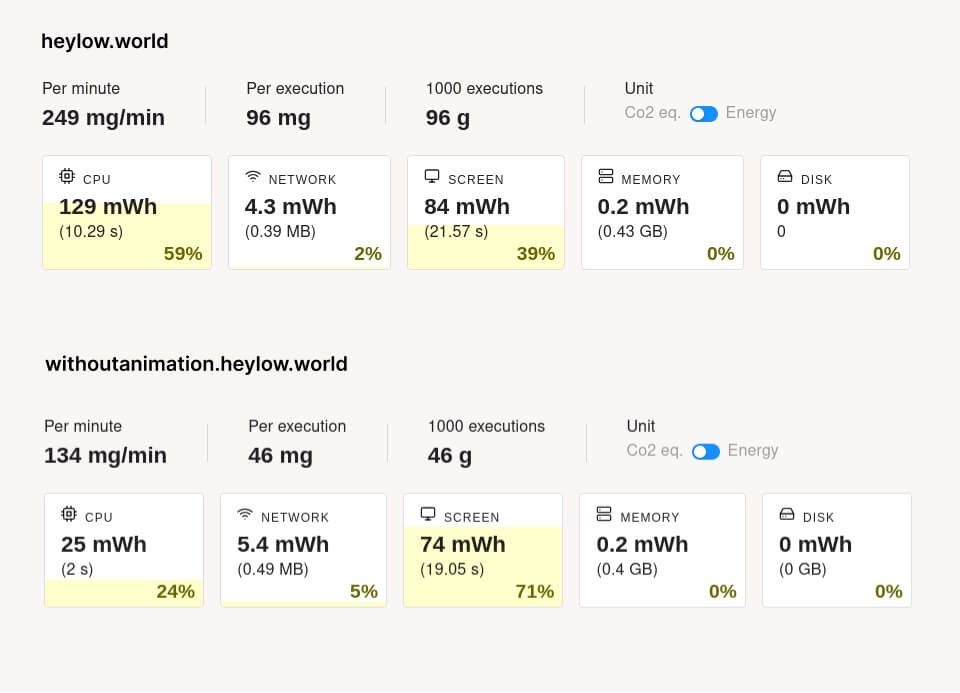
However, when we used GreenFrame, an open-source tool that considers other factors like CPU usage (computer processor), we discovered a 52% difference in power consumption (and carbon emissions) between the two websites (96mgCO2e vs 46mgCO2e). This highlighted that the two websites were not equivalent, as previously thought.

When we examine the results closely, it becomes evident that the key factor defining this difference is the CPU usage. In the animation-free version, the CPU usage is only 25mWh compared to 129 mWh in the initial version. Although the data transfer (network) is slightly higher in the animation-free version (it should be the same, but differences may arise due to missing configurations in the test version), the absence of animation is estimated to considerably reduce its environmental impact.

A more comprehensive approach
This teaches us to have a more comprehensive approach to assess the performance of our website, rather than solely rely on abstract numbers such as gCO2e. We now conduct in-depth analyses using various measures comparing them with similar websites. For performance evaluation, we still use Ecograder, which also provides additional notations to usual measures. Moreover, we employ GreenFrame to estimate our website's energy consumption per minute of use, considering parameters beyond data transfer, such as CPU usage. Using multiple measures, models and comparisons gives us a clearer understanding of our website's performance and is giving us more insight to improve it. We have outlined the results of this approach in our environmental declaration
A focus on typography: implement our learnings in our new website
We could have simply removed the animation that caused accessibility issues and high computational power usage but this way we would have not been true to one of our main values at Hey Low - a focus on beauty and aesthetics. This animation held significant value for us as it created a unique ambience and added personality to our website. Simply eliminating it, without anything to replace it, would have rendered our site somewhat bland and devoid of character.
Our focus extended to typography as we worked on a new iteration of our branding. We aspired to establish a more sophisticated typographic system and take our typography game to the next level. To achieve this, we had to cross the boundary of using a single custom font and sought a solution that struck a fine balance - subsetting font. Subsetting font involves removing all the unnecessary characters, only serving the user a minimal font size. By doing so, we transitioned from loading just one custom font to three, totalling 58.52 kB compared to the previous 24.89 kB. Although it increased data usage by 34 kB, it allowed us to introduce three fonts, bringing more personality to our branding and website. Combined with other enhancements, like introducing butterflies (which we discussed in a previous blog post) and improving imagery, we strengthened our brand identity.
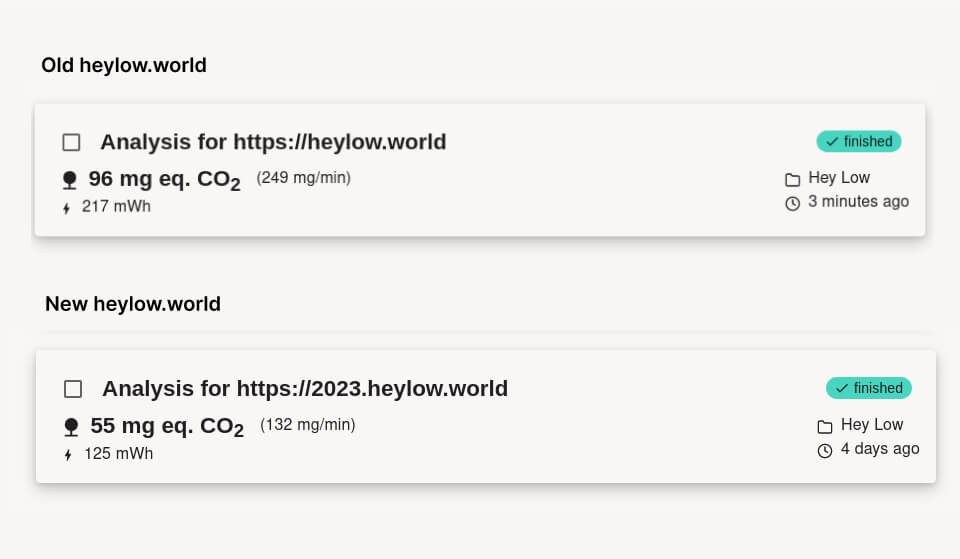
Importantly, these changes (especially the removal of the animation) reduced our estimated environmental impact, despite the minimal CO2 emissions from our previous website, as shown in our environmental declaration.

Living with Nuances:
What We Learned
This experience showed us the value of approaching our work with curiosity and a learning mindset. As the field of digital sustainability evolves, new data and tools emerge, offering better insights and strategies. Embracing these advancements helps us continually improve our practices and minimize our environmental footprint. By removing CPU-intensive elements and thoughtfully adding data on our website, we successfully reduced its s impact while maintaining its uniqueness and character. However, solutions that work today may not be suitable in the future, so we must continue to rely on our intuition and use the data we have to back up our decisions and make informed design choices.